


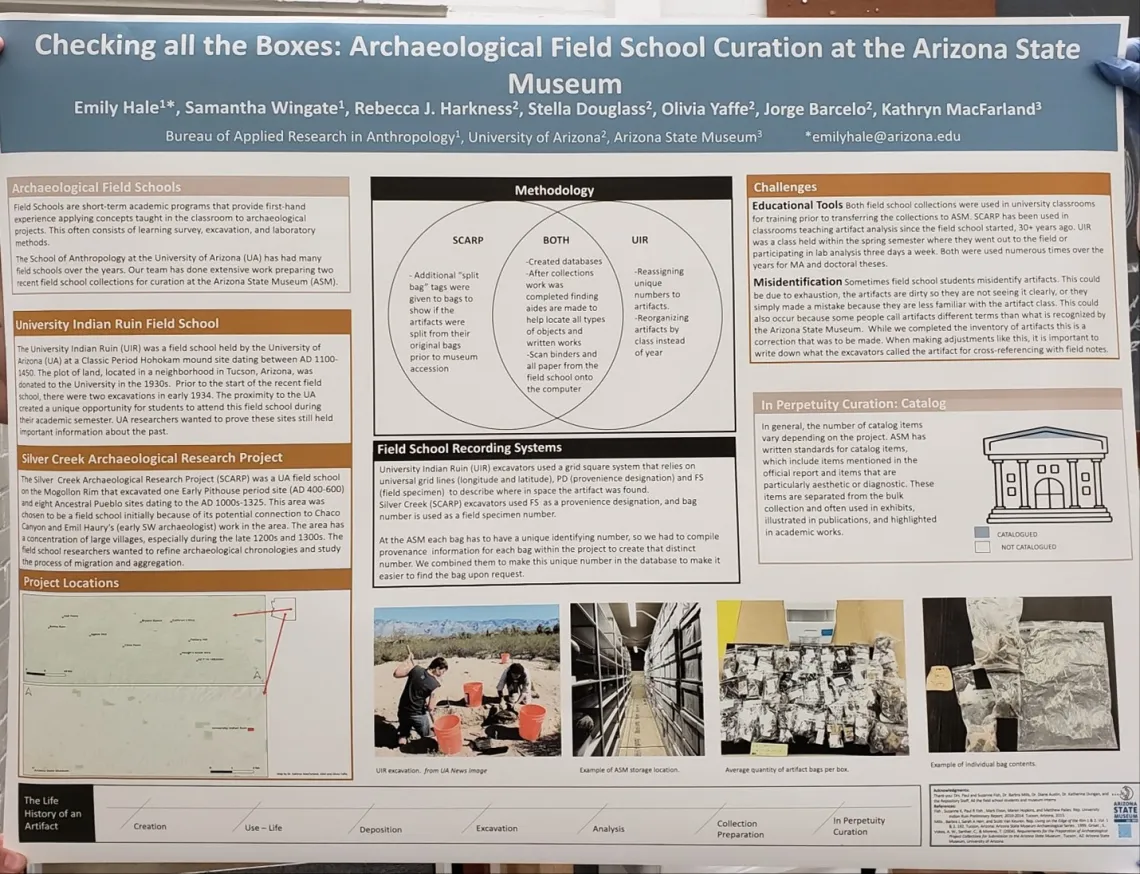
Figure 1: Picture of the poster from the Society for Applied Anthropology Conference (SfAA). On the left bottom there is the complete GIS map shown. The top map is SCARP, and the bottom is UIR.
By Olivia E. Yaffe, ASM Archaeological Repository and School of Anthropology BARA Intern
Spring 2023
Through my second academic year at the University of Arizona, I worked as an intern for a collaborative project between the Bureau of Applied Research in Anthropology (BARA), School of Anthropology (SOA) and the Arizona State Museum (ASM) Archaeological Repository. This project has exposed me to the broader world of Anthropology, and the different quirks that come with it. In this internship, my team and I worked on the bulk box collection by adding new bag tags as well as adding them to the database. This is the second year of this type of program as it started with University Indian Ruin (UIR) in the first year, and SCARP in the second year. The reason for my interest in this particular internship is because I wanted to be an archaeologist when I first came to school. Thanks to Dr. Barbara Mills, I was able to hear about this internship, and apply. With that being said, my favorite aspect of my internship was creating a map with a Geographic Information System (GIS) with Dr. Katie MacFarland. For context, the reason for fabricating a GIS produced map was for the research posters that were presented at the Society for Applied Anthropology (SfAA) conference in March 2023 (Figure 1). On one of the posters seen in Figure 1.1, the main author wanted a map of the two SOA field schools called University Indian Ruin and Silver Creek Archaeological Research Project. In order to create these maps we used a program called QGIS which is a great introductory software for making maps for research purposes. The creation of these maps was challenging as we had to navigate through a program that I have personally never used. Katie was a great teacher when it came to teaching me how to work with GIS. The process might have taken a moderate amount of time, but the overall outcome was fantastic. A few key factors that went into the process were creating shapefiles, which is a storage format, finding sufficient background geographical imagery, finding the perfect colors, and positioning of the map.
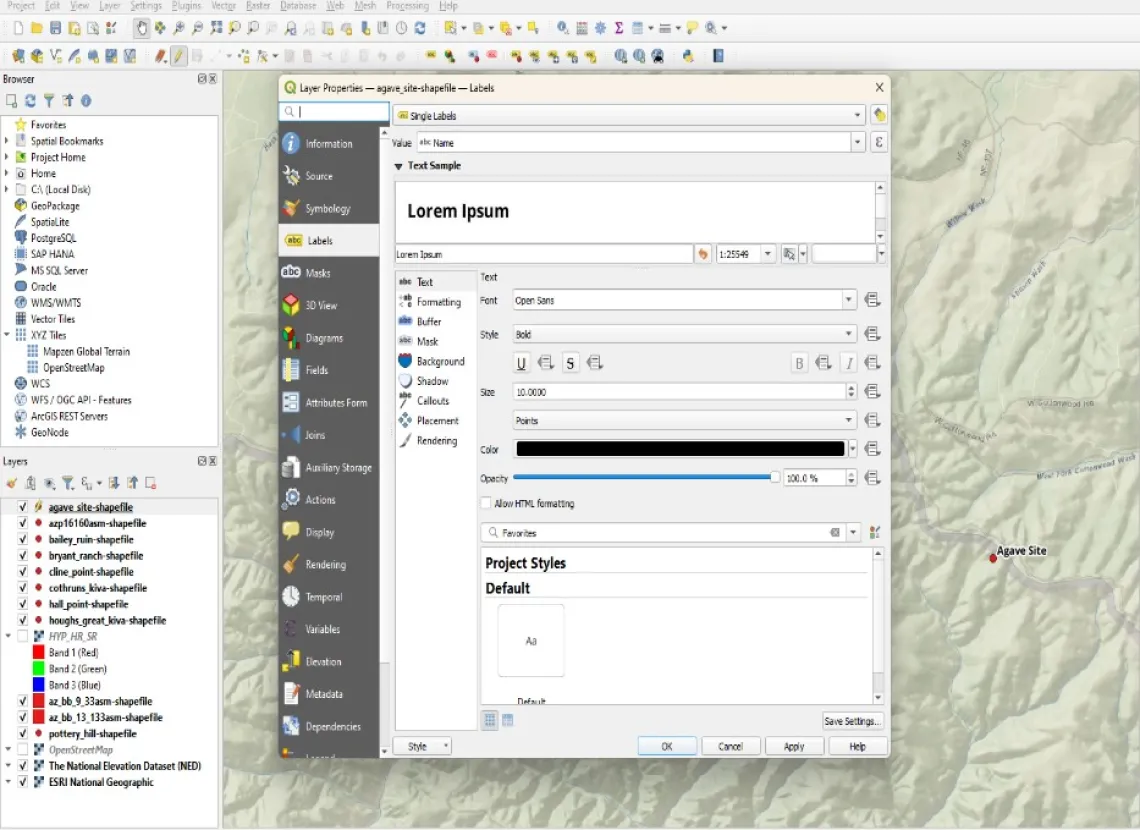
Figure 2: Toggle Editing in QGIS.
Now going more in depth with the creation of the map, there were a lot of technical details that went along with it. As stated previously, shapefiles were needed to get the specific coordinates because the field schools focused on the sites. Once those were created, the next step was to import the files to make the map. After this, we started with the base map where we needed to get a digital elevation map dataset, and for some reason finding the perfect geographical elevation map was difficult. There were some that would not work with the program, and others did not function well for what we needed. Eventually we settled on one called National Geographic which ended up working! After this, it was the home stretch as all we needed to do was edit the way the points were symbolized, and position the map. To fix up the points, we used toggle editing on the QGIS program. This allowed us to change the position of the name, the color, and the boldness (Figure 2). Last but not least, we finished it off, by getting the two maps in the right position in order to save. This way, we were able to transfer each map to PowerPoint to assemble them together into a single figure. Once it was fixed to the appropriate standards, we were able to ship it off to the main author in order to put the map on the poster!
Altogether, the conference went great, and was a fantastic experience for me. The map helped people vision where these sites were located, and how much work was done in the span of these large areas. My overall experience with making the maps was a lot of fun! It was cool to see how GIS programs worked and are used for archaeological research. Throughout my academic career, when it came to learning GIS, I had to take classes and work with datasets that did not pertain to my main interest. I am very happy to be given this opportunity, and I hope in the future I will be able to get even more practice with GIS work.